 Us
Us  Specializations
  Services
  Careers
 Contact
 Blog
Blog


Personal Injury Attorneys are among those who pay the closest attention to digital marketing and, as a matter of fact, PPC for their law firms. Vehicle accidents are among their most sought after cases, but what’s the correlation between road traffic and search intent?
Law firms always look for new clients, for new signed cases, for the maximum ROI. One of the most effective ways to increase a law firm’s caseload is Search Engine Marketing, bilingual PPC, and the practice area with the most competition is Personal Injury. According to our experience, acquired through years of digital marketing for PI attorneys, some of the most significant cases are motor vehicle accidents. In today’s article, we’ll look into what has happened since 2018 regarding what has been happening on the roads and its relation to search volumes and search intent on the Google Search Network.
We’ll start by looking at some critical statistics regarding historical traffic and accidents per year at a National level; then, we’ll look at the specific case of Texas, with an eye on Dallas, and last we’ll review the search volumes, and we’ll examine the correlation between them.
As a side note at this point, we’d like to inform you that our article will be updated in the future with more information about 2020. As of now, the available data is limited, more general, and sometimes based on assumptions.
- 2018
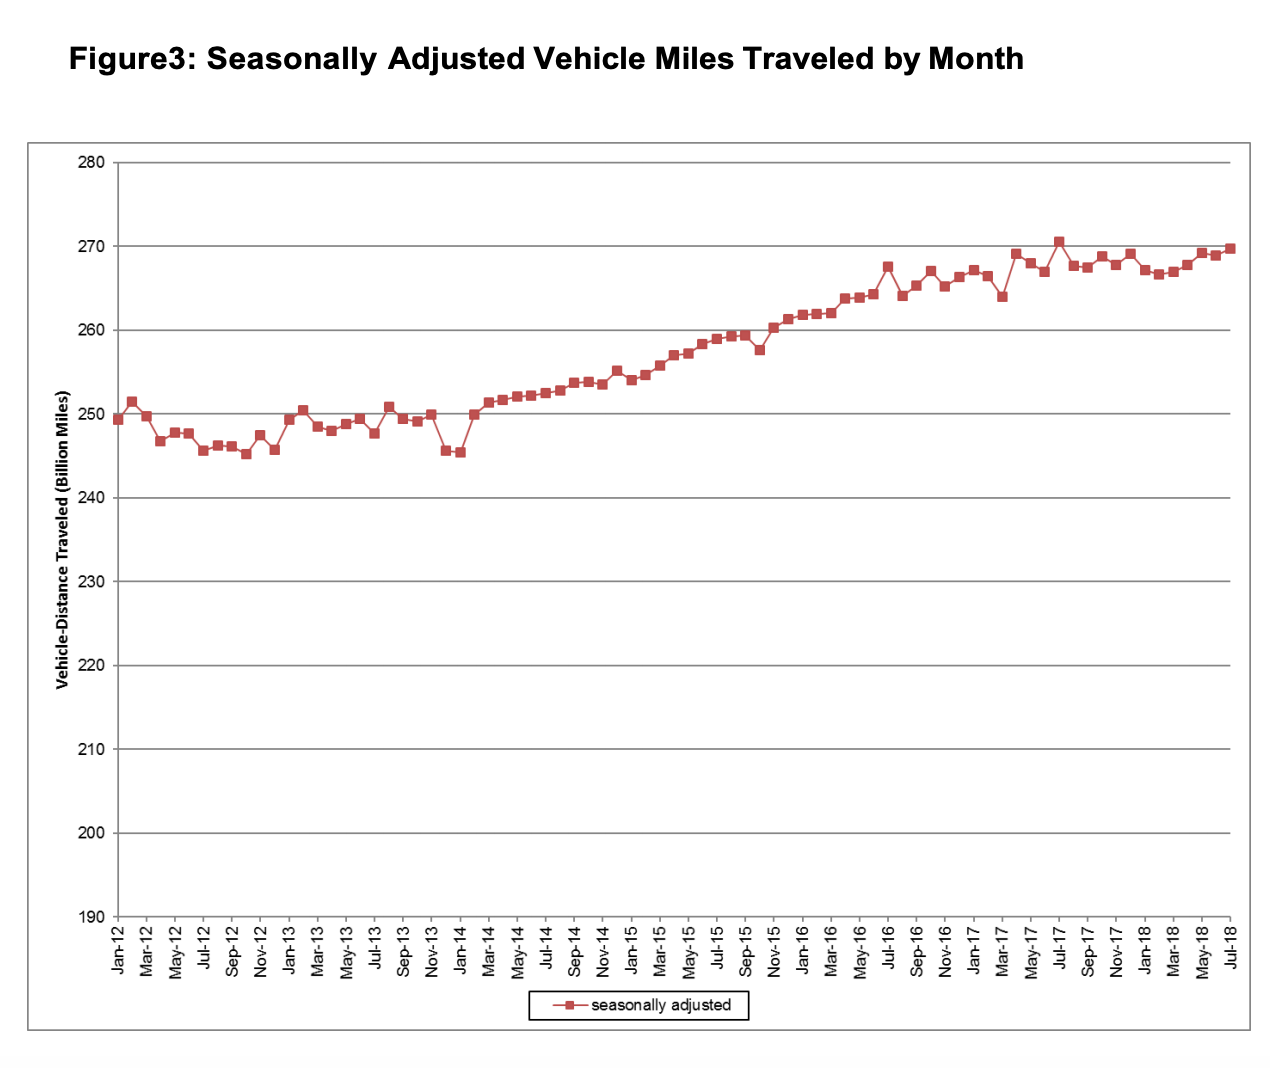
The first data we’ll review is the traffic volume trends at a National level starting from March 2018 till July 2018. The cumulative traffic was up by 0.3% compared to the previous year, for 268,375. Next comes April, with 272,442 (-0.2% compared to 2017), May with 286,172 (+0.8%), June with 281,389 (+0.3%), and July with 288,143 (+0.3%).
Disclaimer: Traffic Volume Trends is a monthly report based on hourly traffic count data. These data, collected at approximately five thousand continuous traffic counting locations nationwide are used to determine the percent change in traffic for the current month compared to the same month in the previous year. This percent change is applied to the travel for the same month of the last year to obtain an estimate of travel for the current month.
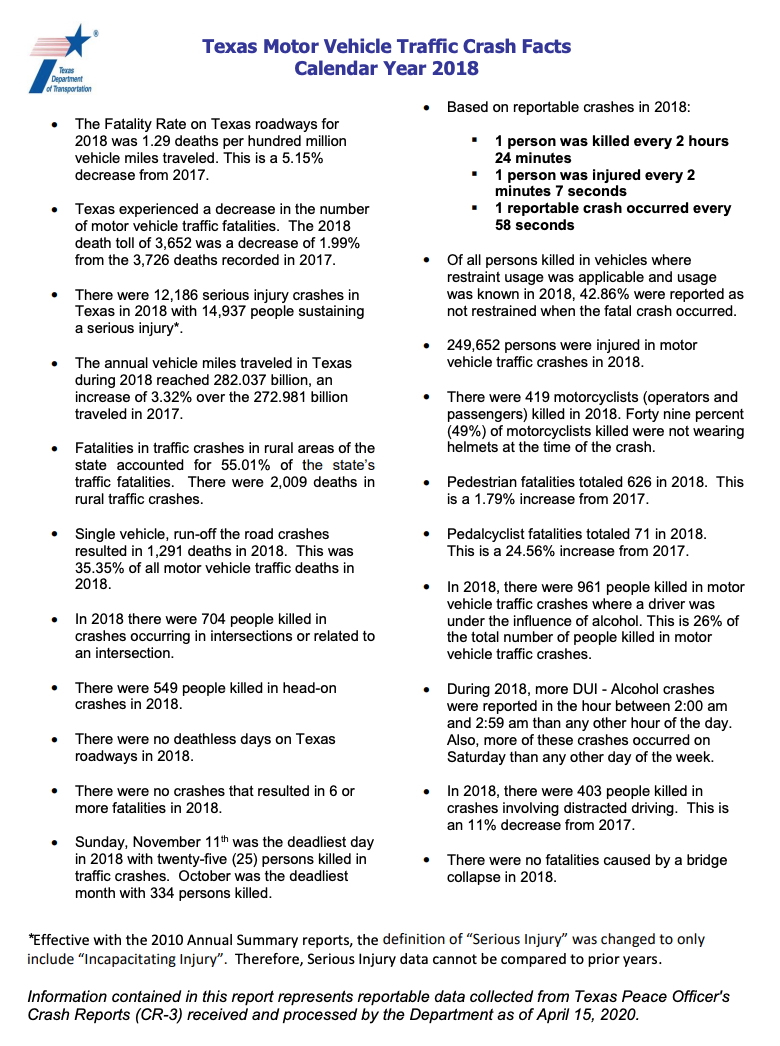
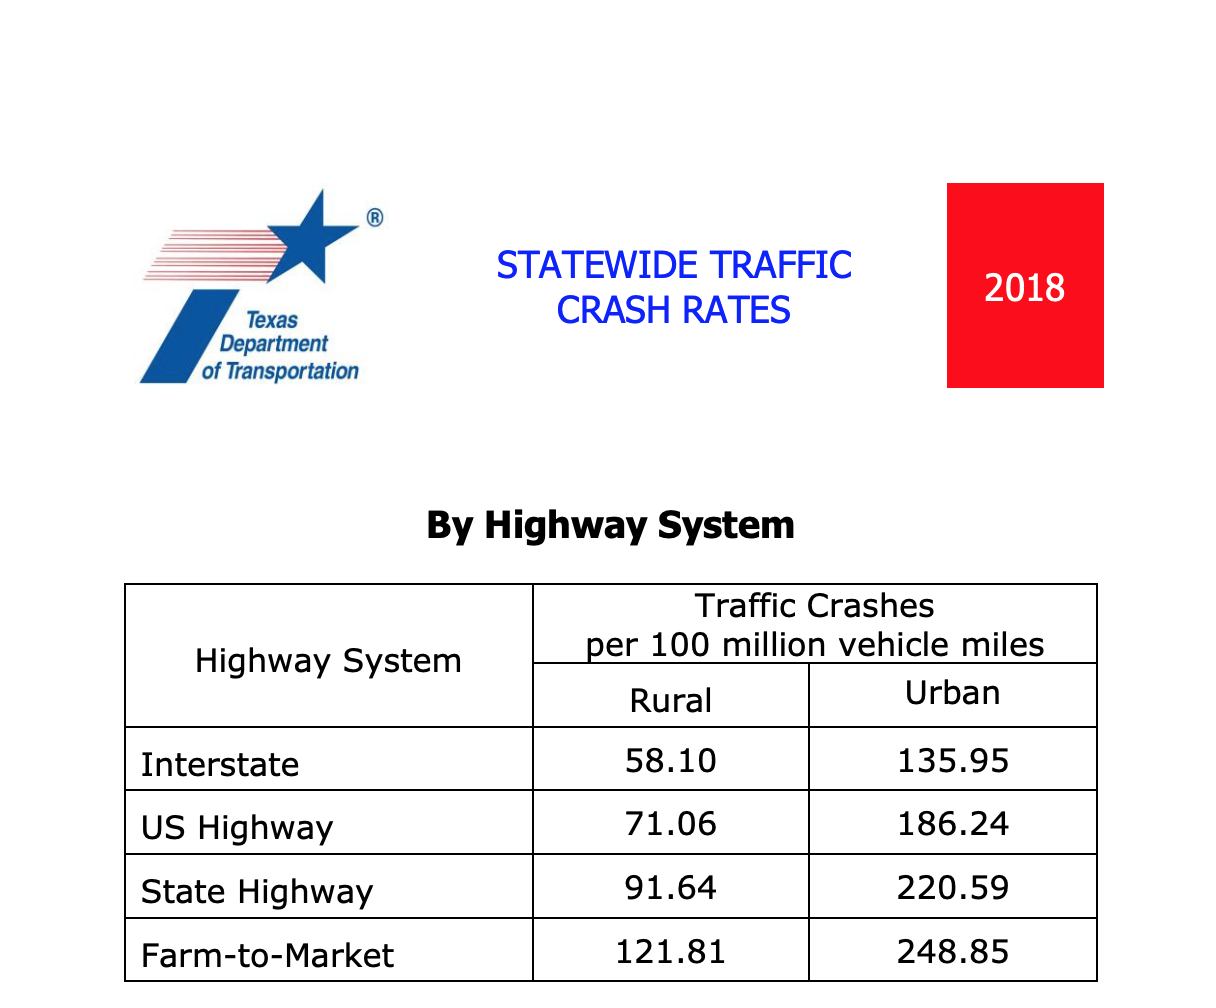
Moving to Texas, according to the Texas Department of Transportation, there were 282.037b annual miles traveled (an increase of 3.32%). The traffic fatalities were down by 5.15% compared to 2017, with 1.29 deaths per 100m people. Below you can find a detailed table with data about accident and fatality rates in the State.
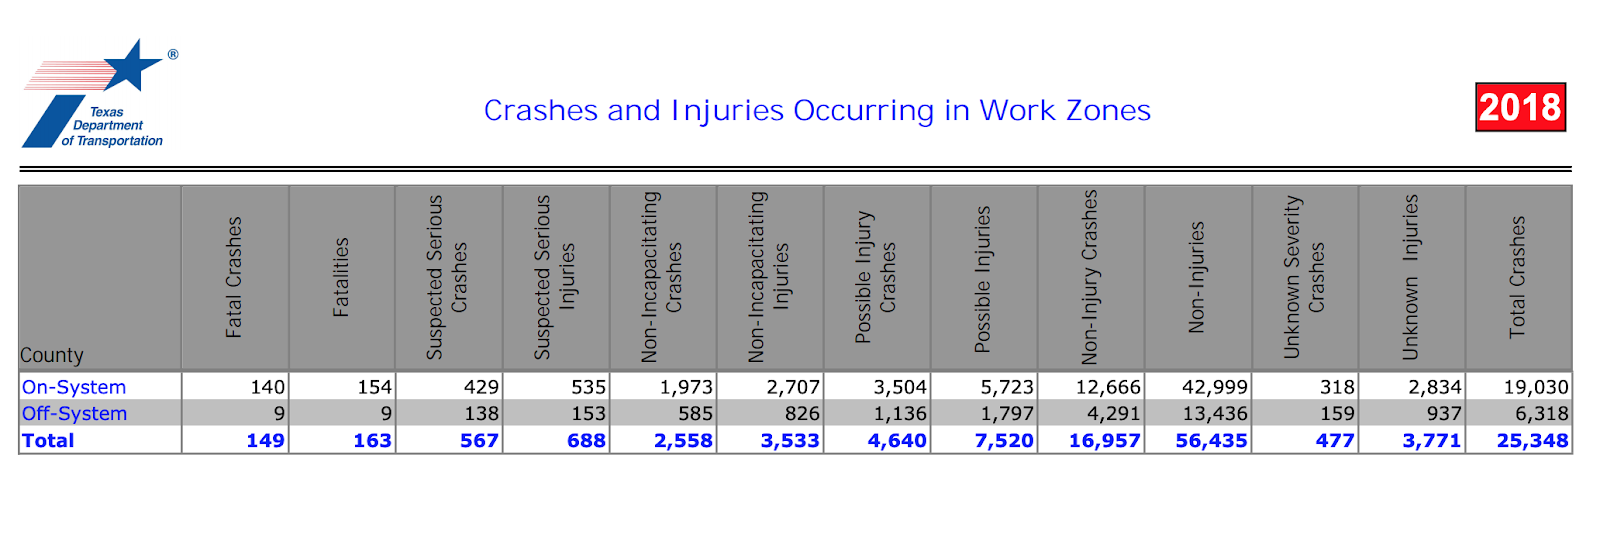
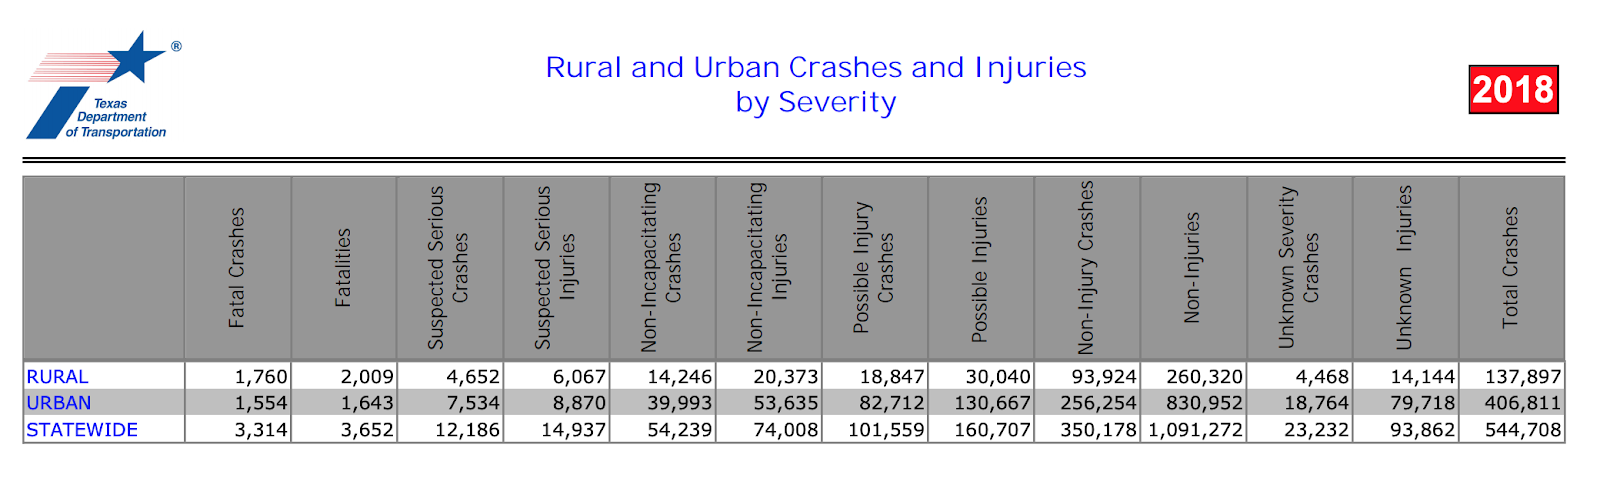
Below you can find the table for Crashes and Injuries in Work Zones for 2018 (1), traffic crashes by highway system (2), and rural/urban crashes and injuries by severity.
(1)
(2)
(3)
- 2019
For 2019, we’ll look at comparable data to understand how the year evolved. Travel on all roads for March was 269.6 billion miles (0.9% increase compared to March 2018); in April, it rose even further to 279.3 billion vehicle miles (0.7% compared to March 2019 and 2% April 2018), and the rise continues in May (1% over last year). June was the first month among those we monitor that recorded a drop (-0.3%) compared to the previous year, while July recovered with a 1.7% increase compared to July 2018 (294.3 billion vehicle miles).
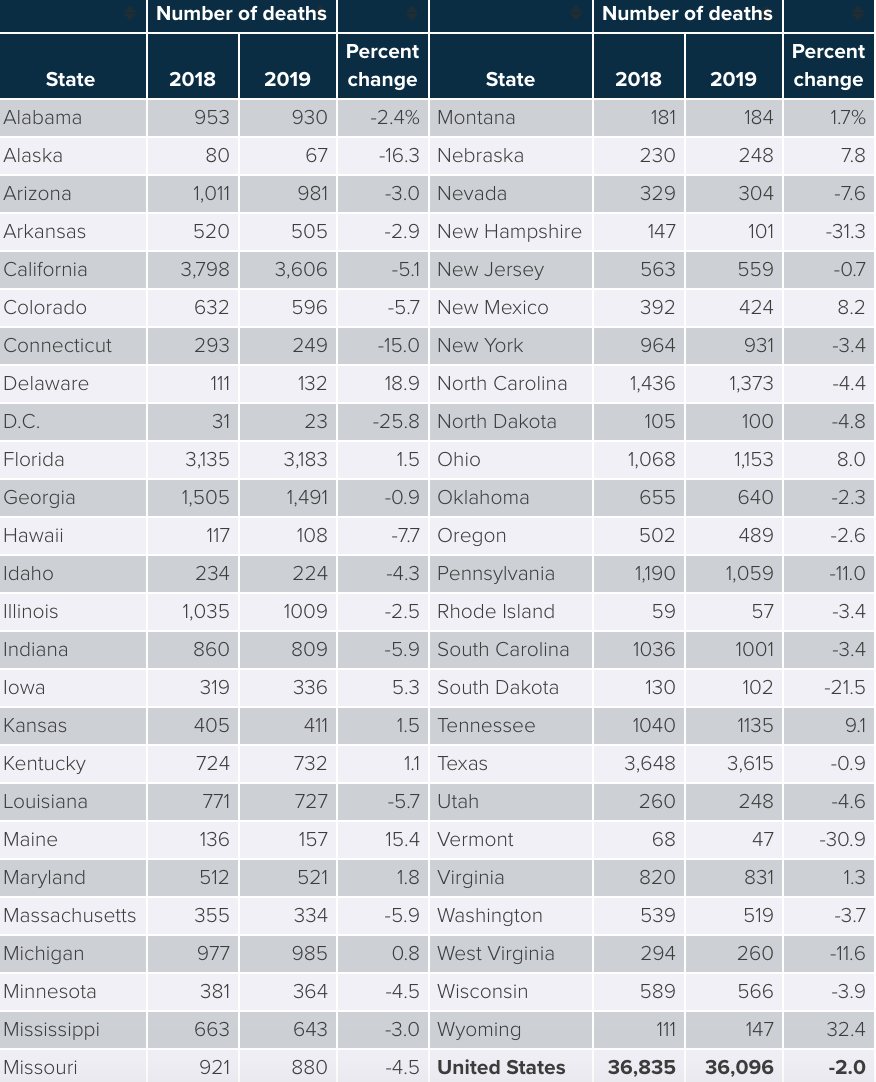
Below you can find the table for motor vehicle traffic facilities according to the insurance information institute.
Let’s now move to Texas again. According to the Texas Department of Transportation, 286.268b cumulative miles were traveled (an increase of 1.5%). The traffic fatalities were further decreased by 2.33% compared to 2018, resulting in 1.26 deaths per 100m people. Below you can find a detailed table with data about accident and fatality rates in the State of Texas.
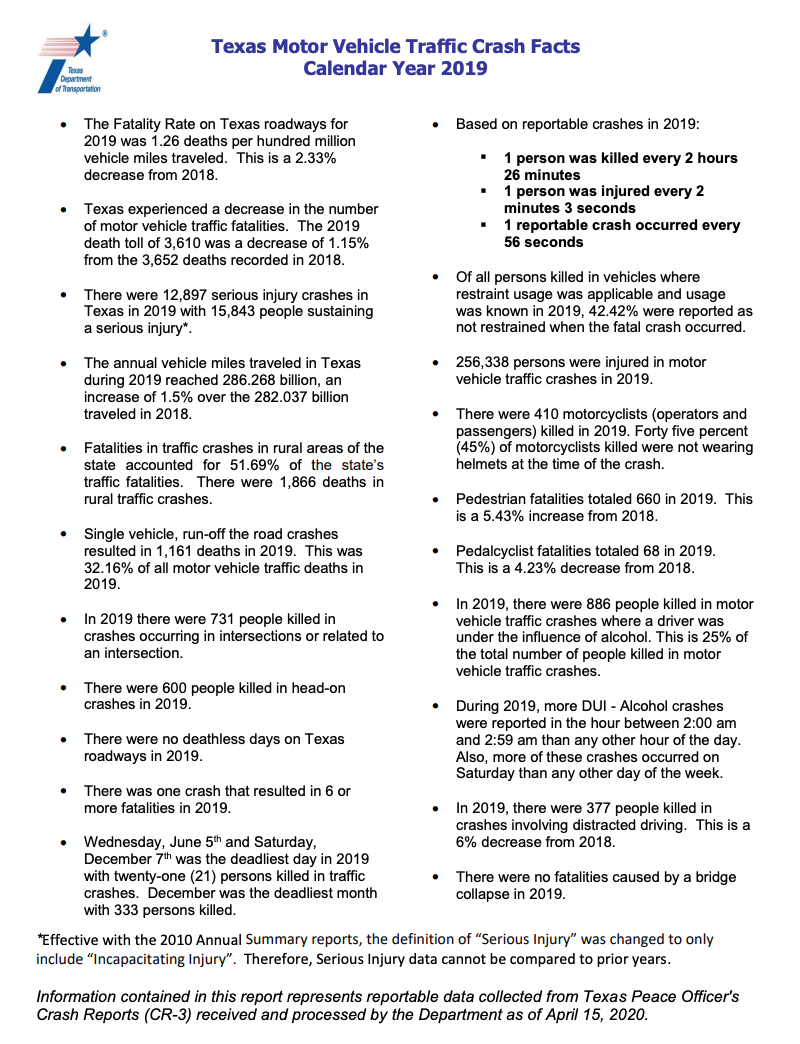
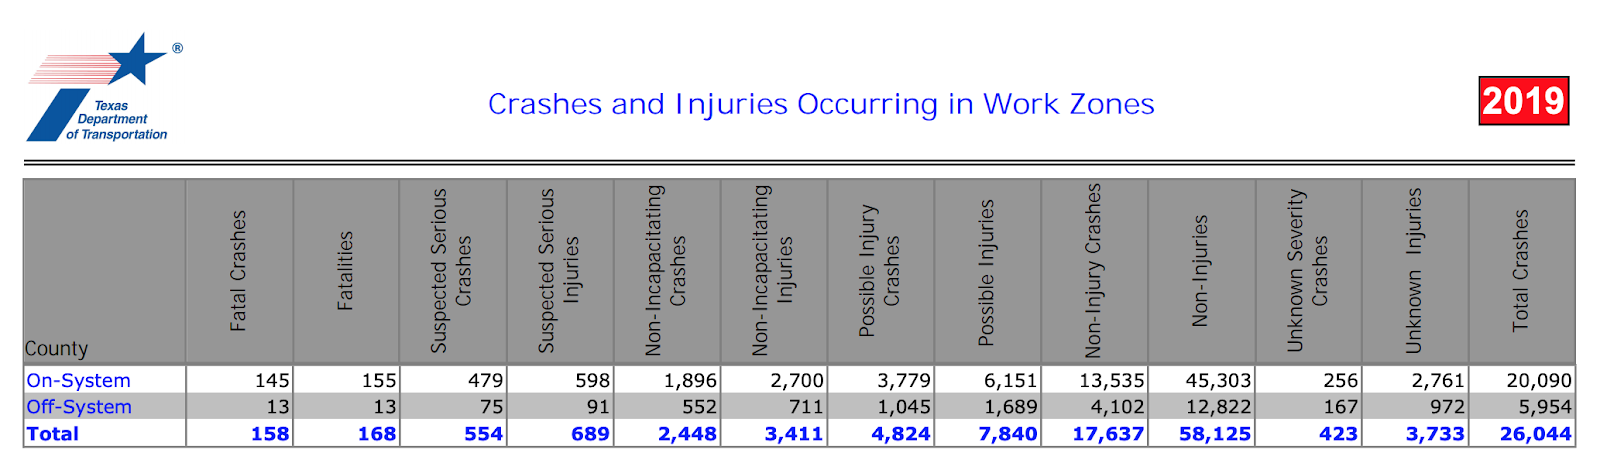
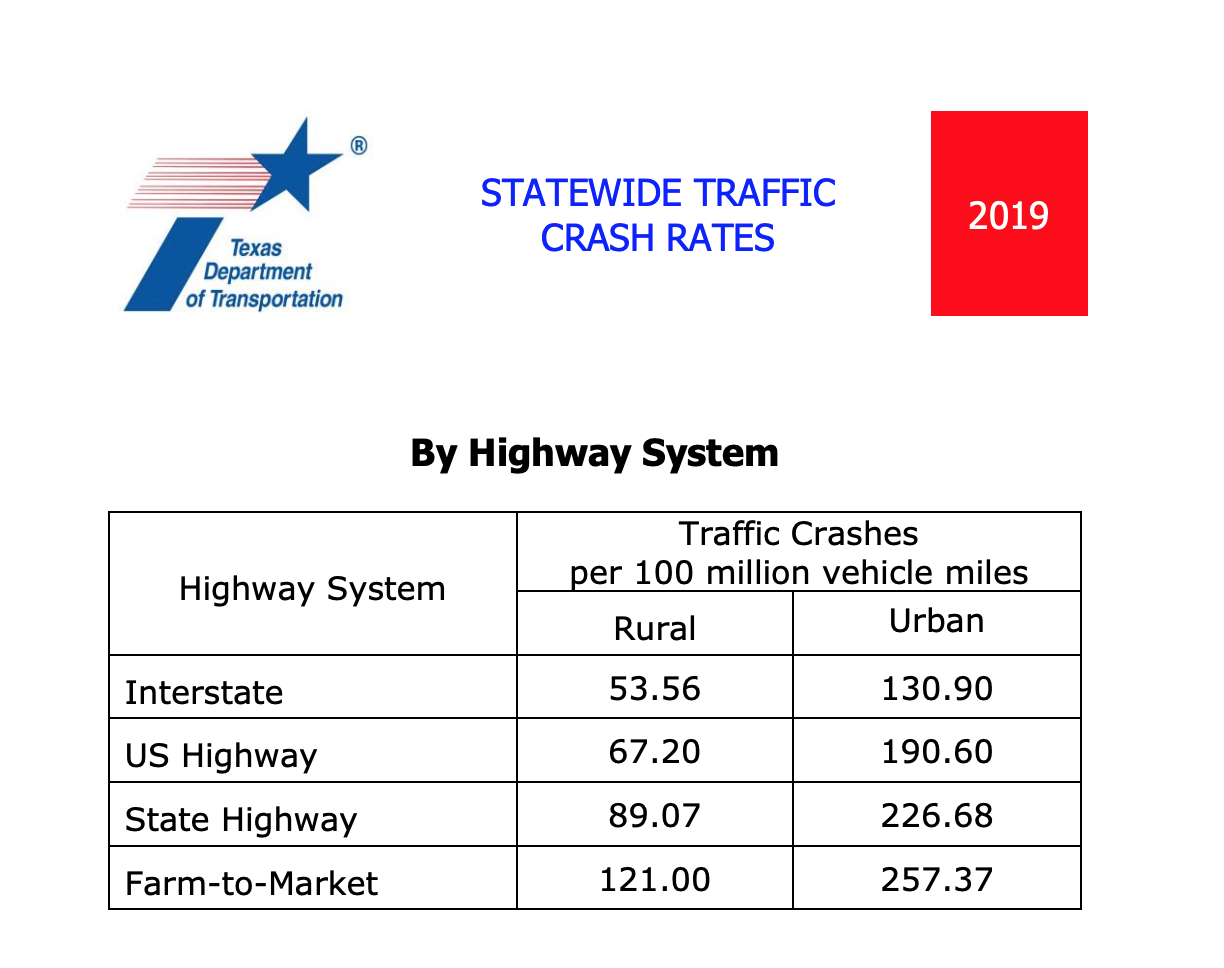
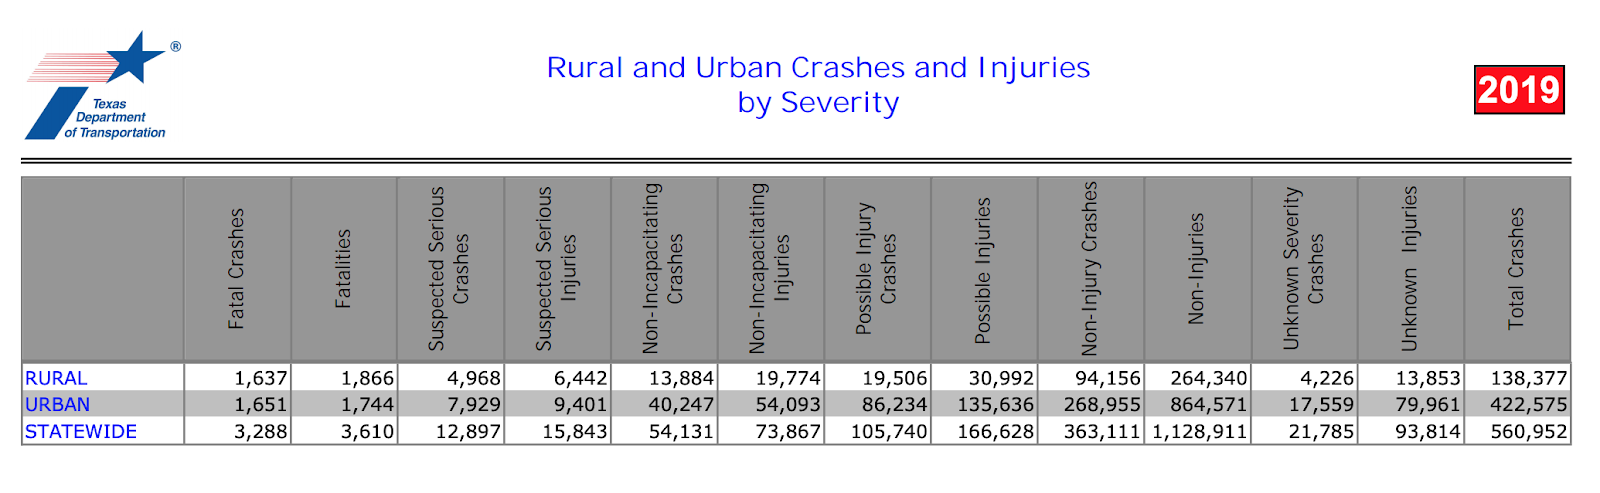
Below you can find the table for Crashes and Injuries in Work Zones for 2019 (1), traffic crashes by highway system (2), and rural/urban crashes and injuries by severity.
- 2020
The current year to date has been affected by the ongoing COVID-19 pandemic, since March we are experiencing unprecedented times, and car traffic volumes and accidents couldn’t stay unaffected. Since the year is not yet over, we don’t have all data in hand, but we’ll look at the most comprehensive and comparable metrics.
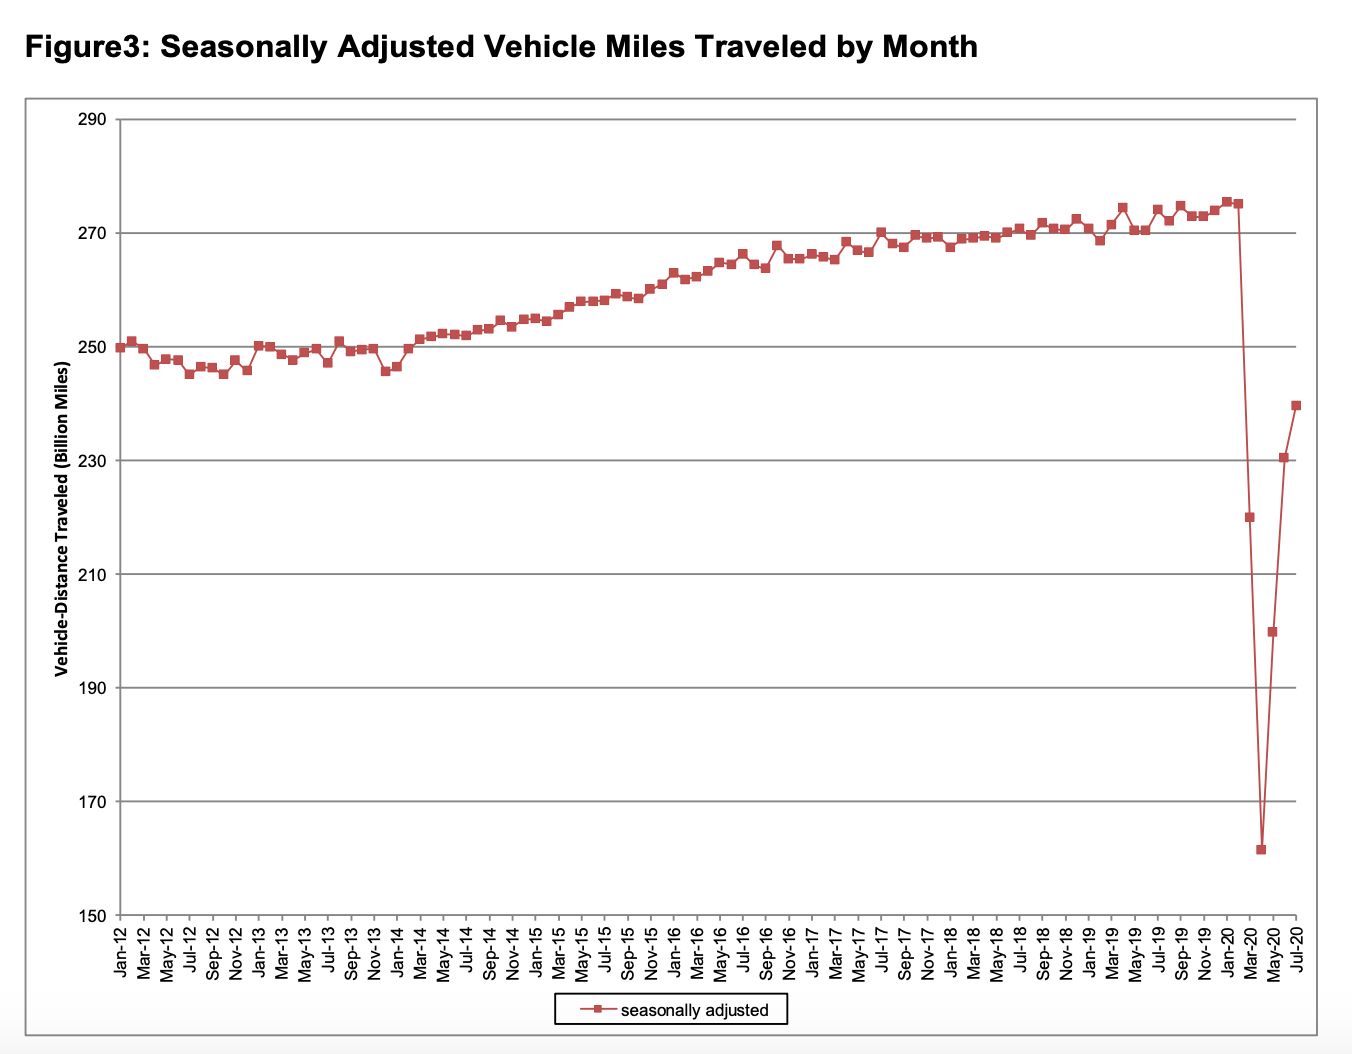
Starting from March, the first month heavily impacted by the lockdown, we noticed a significant drop of 18.6% compared to March 2019, for 221.0b vehicle miles. What makes the effect of COVID-19 prominent is the drop versus February 2020, which is over 19%. April was even worse; with the nation having to deal with the enormous death toll, we recorded 169.6b vehicle miles, a 39.8% drop. May was no different with 213.2b vehicle miles and a 25.5% drop. Again, June and July were in the minus with a 13% and 11.2% drop, respectively.
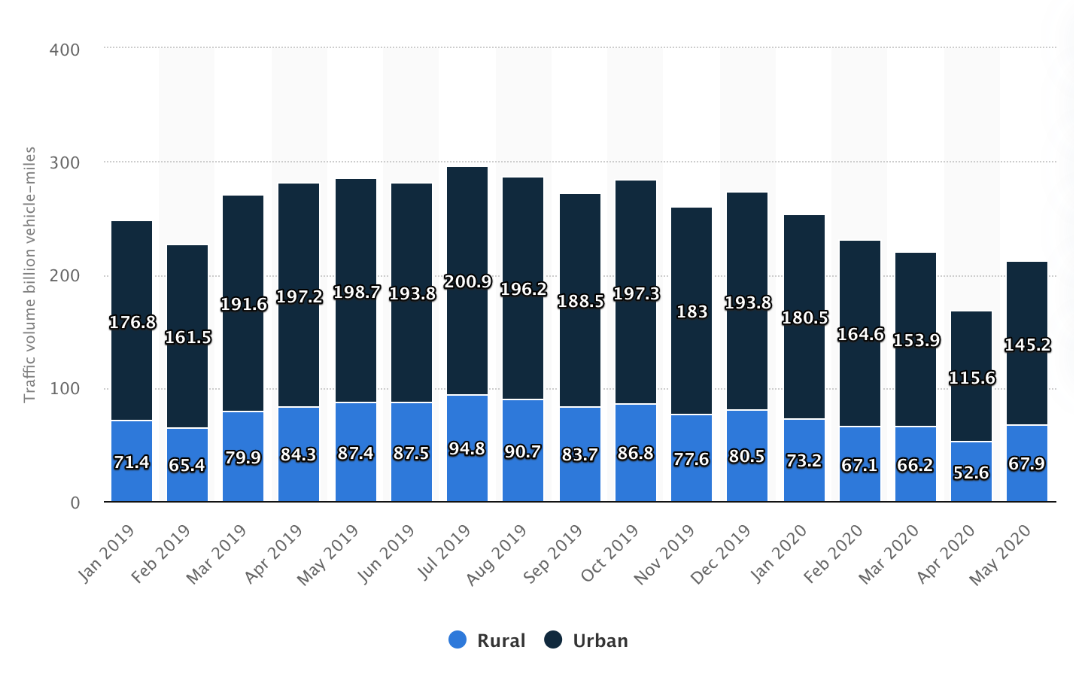
Below you can find two graphs displaying the decrease in traffic compared to previous years. On the second one, coming from statista.com, you can see the difference taking into account urban/rural traffic.
Since we are still in 2020, States have not released their official data, and therefore we can’t display Texas-specific data, but stay posted as we will update the article once the stats are out.
- What’s the correlation between traffic volumes, accidents, and search volumes/intent.
Here, we’ll review the three years, with an eye on March-July, trying to understand the impact of COVID-19 on PPC for PI Law Firms.
We’ll start at a national level in English, we’ll move to Texas and Dallas, and then we’ll discover what happened in high intent keywords in Spanish.
2018:
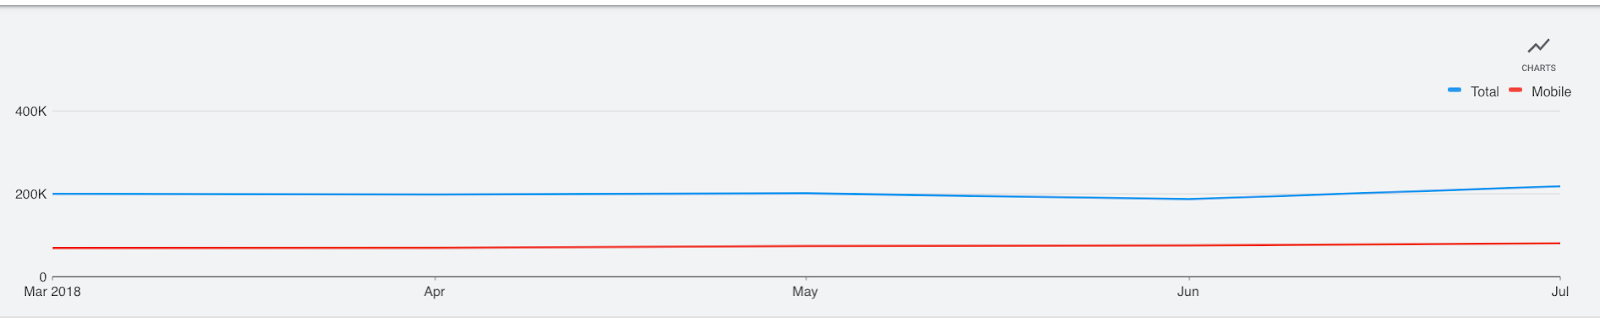
We examine some of the high intent keywords for PI Attorneys who invest in PPC. In 2018, at a national level, from March to July, we see a steady search volume around 200k, peaking at 221k, and having a lower point at 189k.
2019:
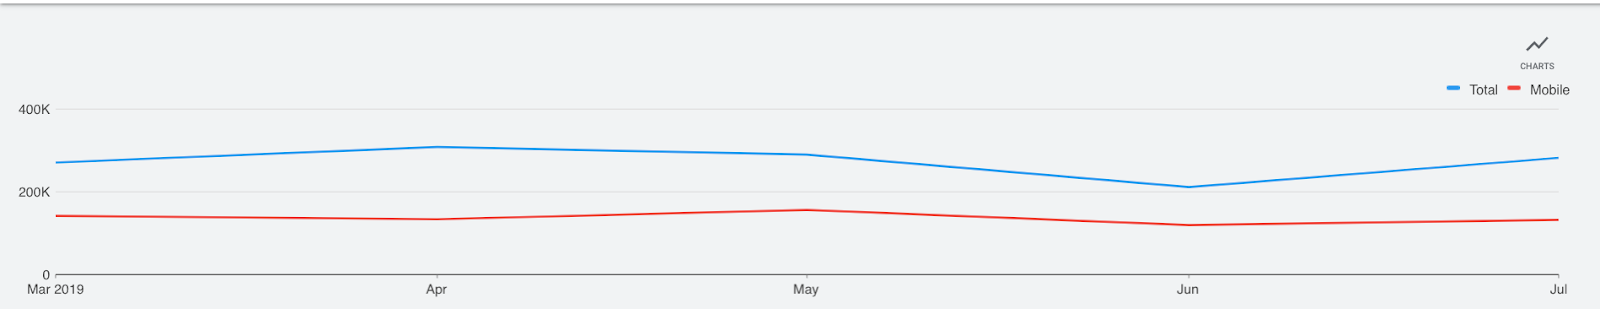
Interestingly, for the same keywords, in the same timeframe, 2019 search volumes stay over the 200k, peaking at 308k in April, with a lower point in June (same as the previous year) with 211k searches.
2020:
What would you expect for search volumes now that you have read the stats for traffic and accidents compared to the previous years? Well, we suspect that you’d expect a drastic decrease, but that’s not the case.
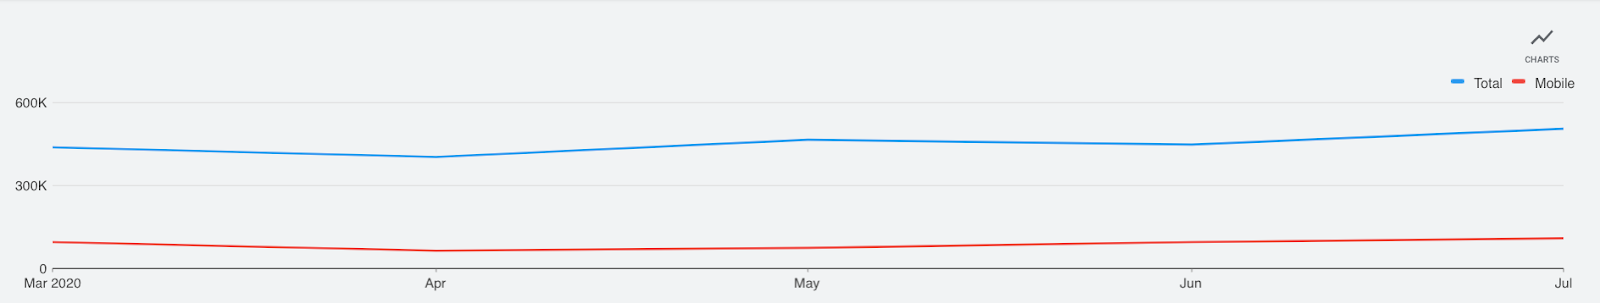
The streets might be quieter in the last months, but the interest has increased, not for any keyword, but some of the most relevant and competitive phrases (exactly like in previous graphs). These include car accident attorney near me, motorcycle attorney, and personal injury attorney near me. There’s no month under 400k (April is standing at 404k, while July is a record month with over 505k searches.
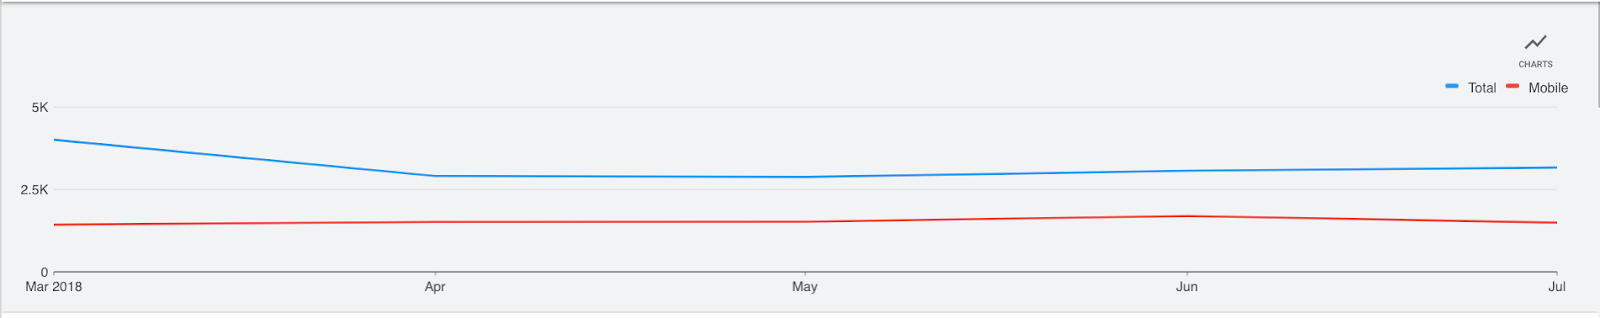
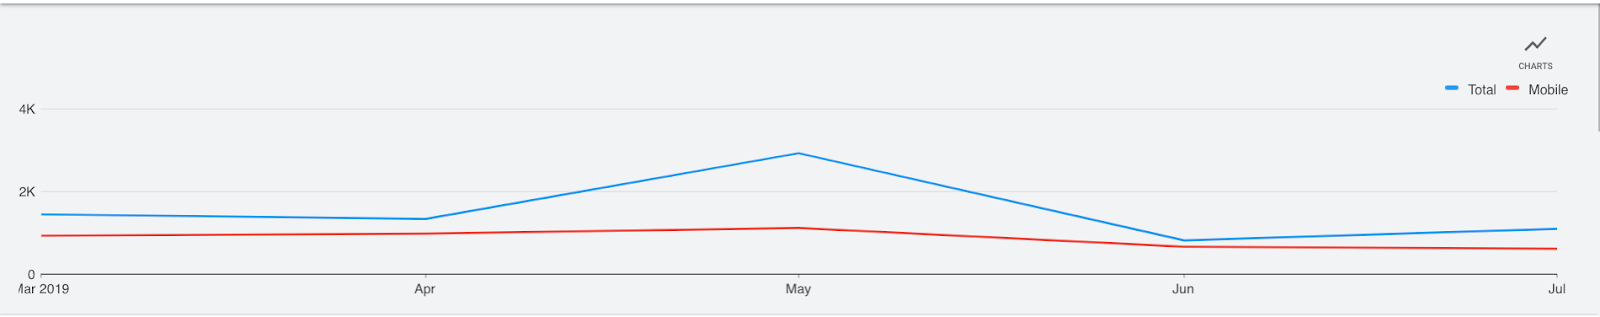
Moving forward to Dallas, we see that search volumes peak in March 2018 with 4k and generally remain around 3k.
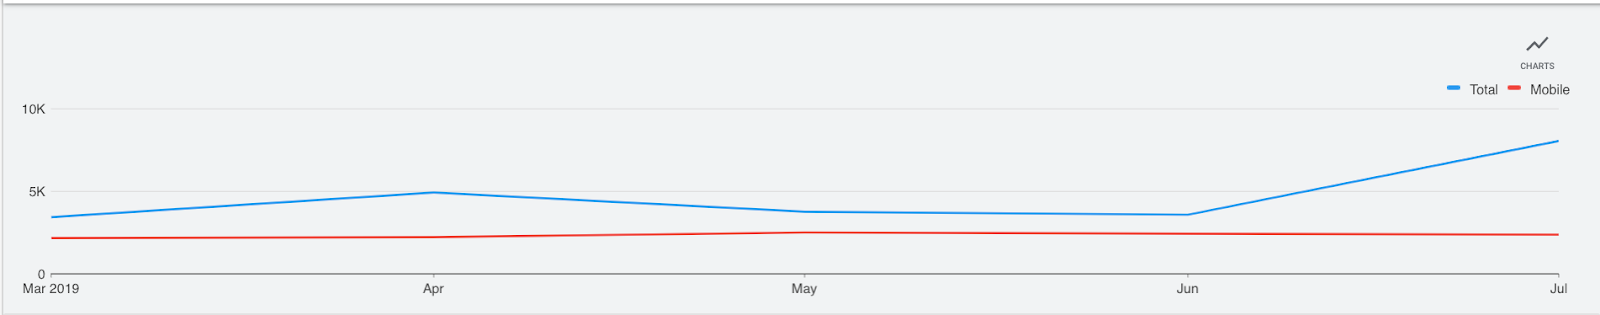
2019 was for the most months close to the 4.5k mark, but as we can see in the graph, it peaked in July, approaching the 10k searches.
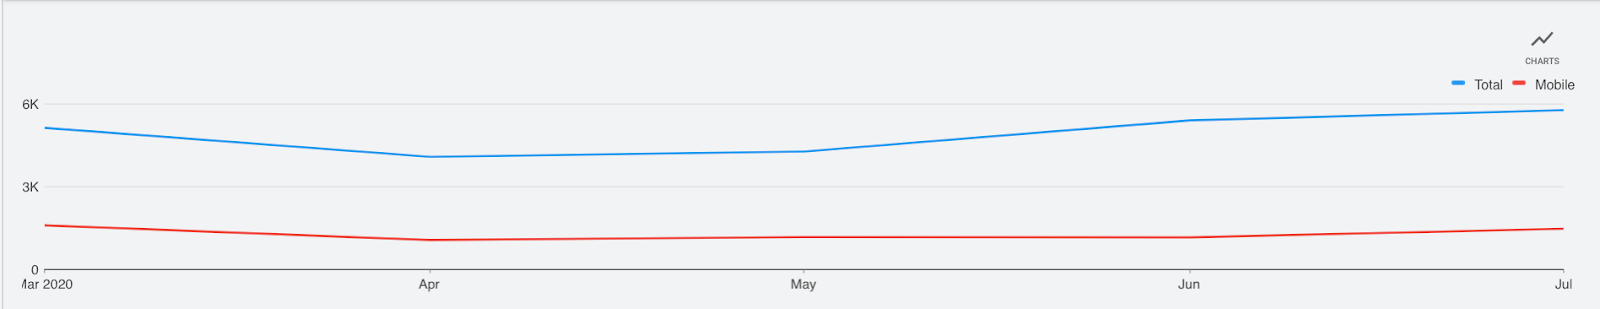
Looking at the graph for March to July 2020, we can see a drop in the first months, leading to volumes at just over 4k in April to a substantial recovery in June and July with over 5.7k searches.
Let’s now look at the same high intent keywords in Spanish, starting with Dallas.
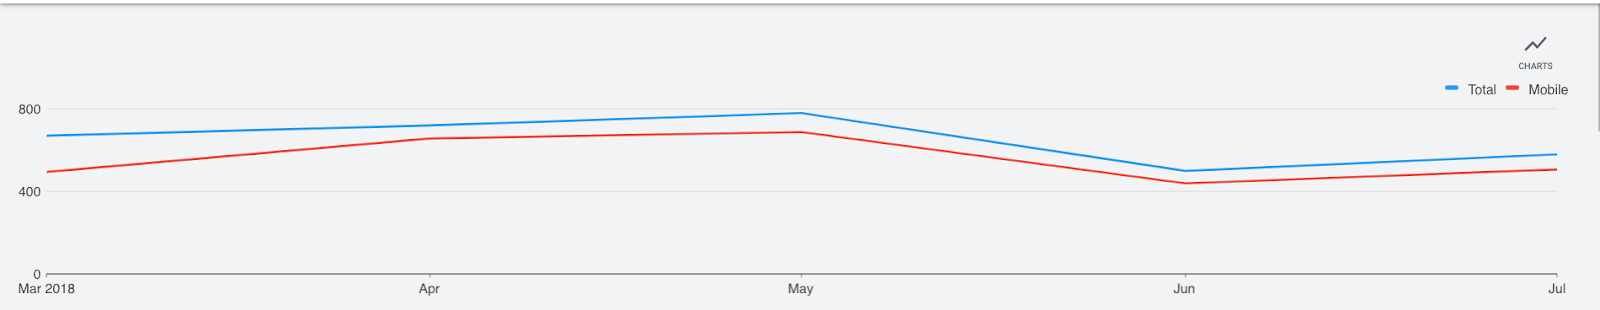
In March-July 2018, search volumes ranged from 500 to 780, peaking in May and having the lowest point in June.
2019 signaled a considerable rise in search queries for PI Attorneys, coming from Hispanics. We can notice that May was a record month with over 2.9k searches (it’s the 3rd highest we’ve seen).
What could one expect for 2020? Road traffic and accidents have been lower compared to both previous years, but as we see in the graph, 2020 is performing better than 2018 in terms of interest and Google searches.

Finally, let’s look at the big picture for Hispanic terms; what’s been happening nationwide?
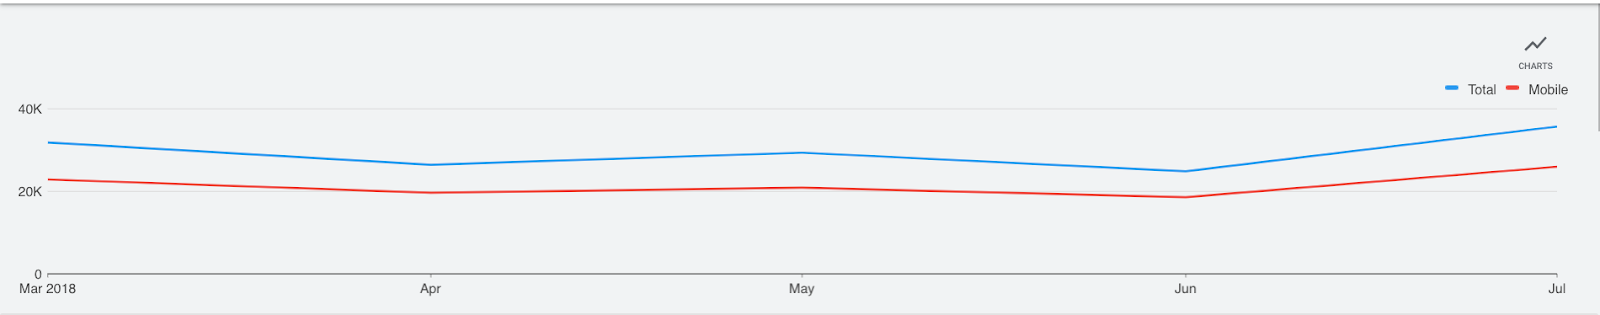
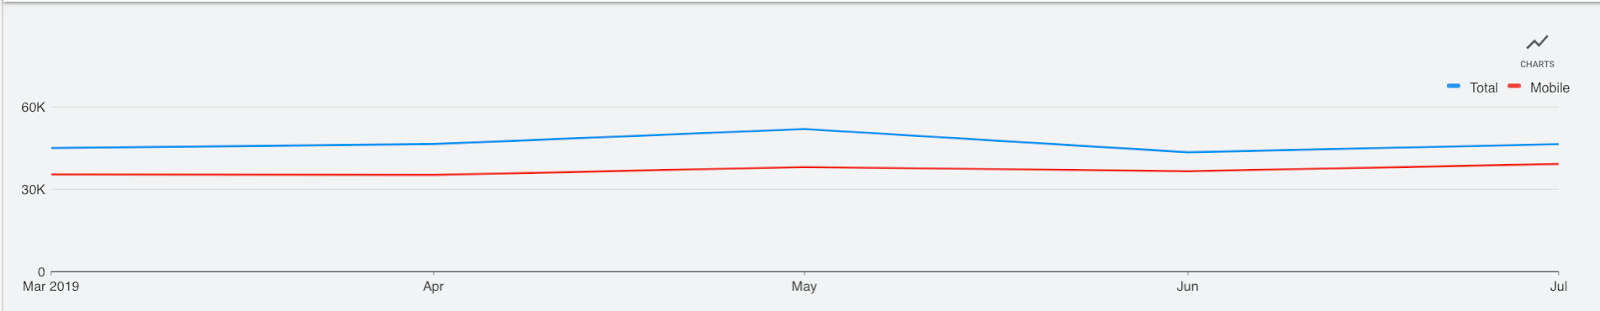
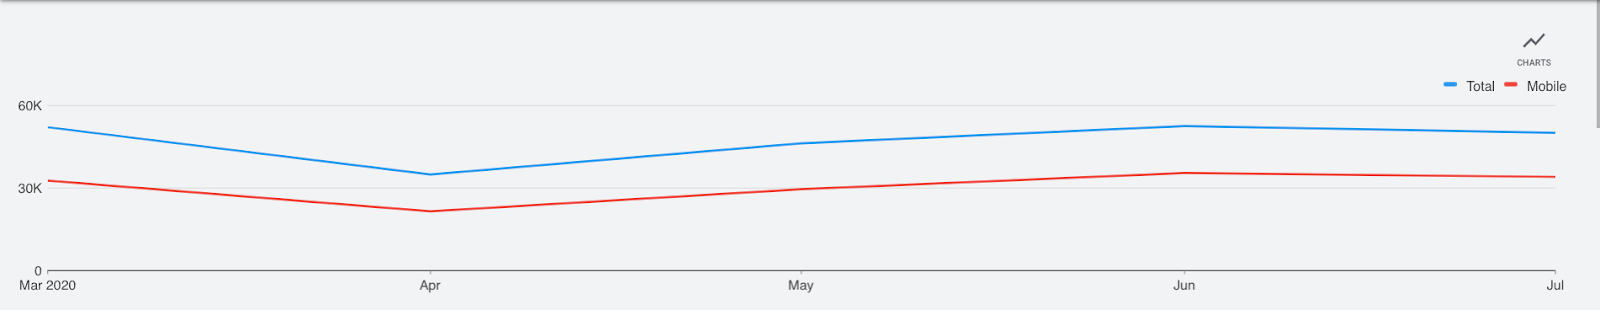
2018 (1st graph) has been at the lowest volumes of the last three years, with total queries under 40k per month (lowest 24.8k, highest 35.7). 2019 (2nd graph) was stabilized over 40k with a peak at 52k and a lower point at 43.5k. 2020, as one could’ve predicted, hasn’t been as stable as the previous year, but its worst month, April, stands at 35k and its best at over 52.5k, showing a healthy recovery after the initial shock.
Our Conclusion:
You might wonder how it’s possible to maintain healthy and competitive search volumes adequate for PI Law Firms to grow by investing in bilingual PPC. We see that the world is turning to digital for their most common needs, which becomes even more prominent with younger generations and Hispanics. Especially nowadays that we practice social distancing and stay at home, we tend to live and socialize online, so that’s how we’ll search for the services we need. Our advice to Attorneys is not to panic based on rumors or early signs. It’s crucial to maintain a long-term strategy, evaluating it based on real data, such as conversions, newly signed cases, case value, and ROI. A highly relevant PPC campaign with an excellent Quality Score can be your best investment for sustainable growth.
